RetrySight Cloud staging is live.

Open Cloud

How RetrySight works

Turn local coding-agent logs into retry timelines, cost reports, and fleet visibility — on your desktop, in managed Cloud, or self-hosted Enterprise. Install guides live in Docs.

System architecture

Cloud and Enterprise share the same collector → manager → dashboard pattern. Lite collapses collector and manager into a single local process.

Coding agents Cursor · Claude Code · Codex · …
session logsedit eventstoken usage
Collector on each developer machine
retry eventsheartbeatssession batches
Manager fleet control plane
KPIstimelineslive feed
Dashboard fleet console
writes
taskseventscost records
Data store fleet history
query results
reads back to manager → dashboard
Optional outputs from manager
Analytics warehouse
aggregated metricscost rollups
IDE assistant tools
task summariesretry stats
Long-term archive
historical events
Insights assistant
fleet summaries
Directional data flows — each arrow shows the datasets moving between components, from local agent activity to fleet-wide visibility.

Data flow

Five stages from a single coding session to insights across your entire engineering fleet.

  1. Capture

    Agent activity on the developer machine is read as it happens.

    raw session events
  2. Buffer

    Events queue locally so nothing is lost during brief disconnects.

    queued batches
  3. Ship

    Batches flow to the central manager across the fleet.

    retry + token batches
  4. Store

    Tasks, timelines, and cost roll up into the fleet data store.

    taskscost records
  5. Surface

    Dashboards and reports refresh for the whole engineering fleet.

    KPIsreports
Each stage transforms and forwards specific datasets toward fleet-wide visibility.

Where it runs

Lite stays on your machine. Cloud collectors send data to our hosted manager. Enterprise keeps the full stack inside your network.

Across your developer fleet
Collector machine 1
retry events tokens
Collector machine 2
retry events tokens
Collector machine 3
retry events tokens
+ more
inbound
session batchesheartbeats
Your infrastructure (self-hosted)
Fleet console dashboards & reports
← KPIs ← reports
aggregated metricslive feed
Manager routes & aggregates
writes
taskseventscost
Data store fleet history
query results
Collectors push session batches inward; the manager writes fleet history and reads it back to power the console.

Collector

Sits on each developer machine and watches agent activity as it happens. In Lite, collectors run in-process; in Cloud and Enterprise they run as a lightweight background collector service.

  • Reads sessions from Cursor, Claude Code, Codex, and more
  • Queues events locally — nothing lost if the link drops briefly
  • Sends retry and token data to the manager (local or remote)
Manager

The fleet brain — receives telemetry, stores it, and powers reports and alerts. Hosted by us in Cloud; runs in your Docker stack for Enterprise; embedded in Lite's backend.

  • Aggregates events from every collector in the org
  • Rolls up cost, retries, and session timelines
  • Feeds the dashboard and optional analytics outputs

Dashboard

The console engineering leaders and platform teams use every day — web UI for Cloud and Enterprise, Flutter desktop for Lite.

  • Fleet KPIs — retry rate, token spend, active collectors
  • Drill into tasks, sessions, and retry timelines
  • Live feed updates as developers work

Retry event taxonomy

RetrySight classifies agent behavior that vendor dashboards miss — the signals FinOps and platform teams need.

Edits & compaction

Track edit loops and context compaction events that burn tokens without visible output.

edit loops compaction context shrink

Test & diff outcomes

Test failures, diff rejected, and diff accepted — the retry patterns behind wasted spend.

diff rejected test failures diff accepted

Subagents & sessions

Subagent loops, session boundaries, and task aliasing across collector restarts.

subagent loops session bounds task alias

Token usage

Input, output, cache read/write, and reasoning tokens by model, user, and source tool.

input / output cache tokens reasoning

Collector health

Agent heartbeats and stale-collector alerts before data gaps appear in reports.

heartbeats stale alerts liveness

Evaluations

Eval definitions, runs, annotation queue, and playground — Analytics+ and above.

eval runs playground annotation

Eval experiments

A/B experiment runs for measuring agent quality over time — Integration+ and above.

A/B experiments quality runs

Tier stack

Higher Enterprise tiers inherit capabilities from tiers below.

Cloud Scale

Enterprise scale on-prem

Everything in Integration, plus push ingest for outbound-only networks and more.

Integration

MCP, ClickHouse & OTel

Everything in Analytics, plus mcp server for cursor, vs code, and kiro and more.

Analytics

FinOps & reporting

Everything in Core, plus cost and retry analytics pages and more.

Core

Foundation

Ingest, dashboard, tasks, and agents, Live feed and retention purge, and more.

Higher tiers include all lower-tier capabilities, enforced server-side.

Full tier cards and the feature matrix live on Pricing. For controls and residency, see Security.

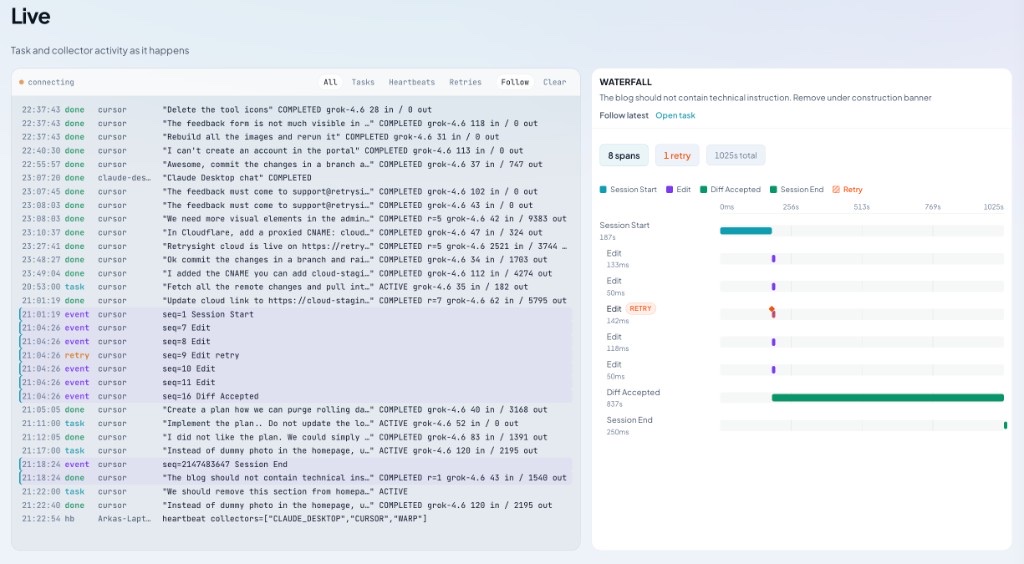
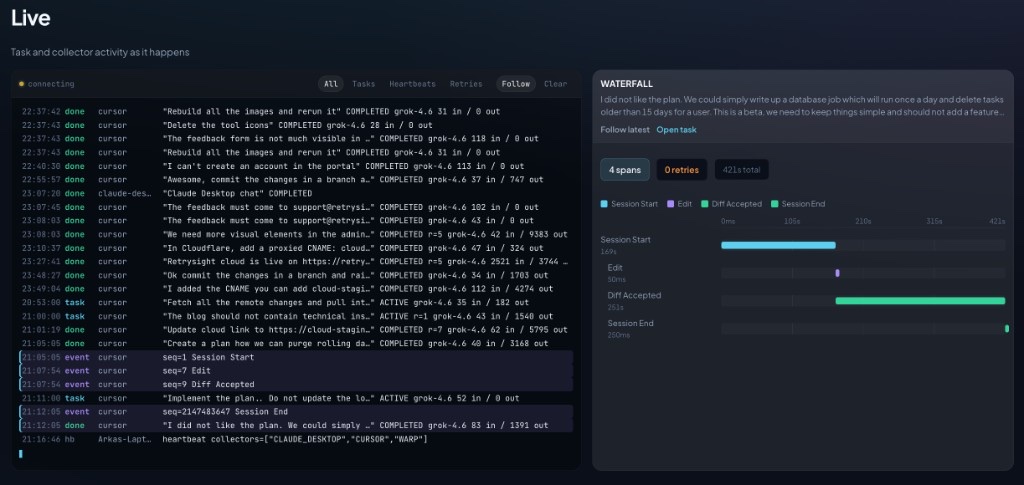
The console your team will use

The Live view from RetrySight Cloud — task and collector activity as it happens.

cloud-staging.retrysight.com ● live
RetrySight Cloud Live view showing task and collector activity with a waterfall of session spans RetrySight Cloud Live view showing task and collector activity with a waterfall of session spans

Pick your deployment

Try Lite locally, start a Cloud trial, or self-host Enterprise.